
How Electrical Penetration Graph (EPG) Recording Works
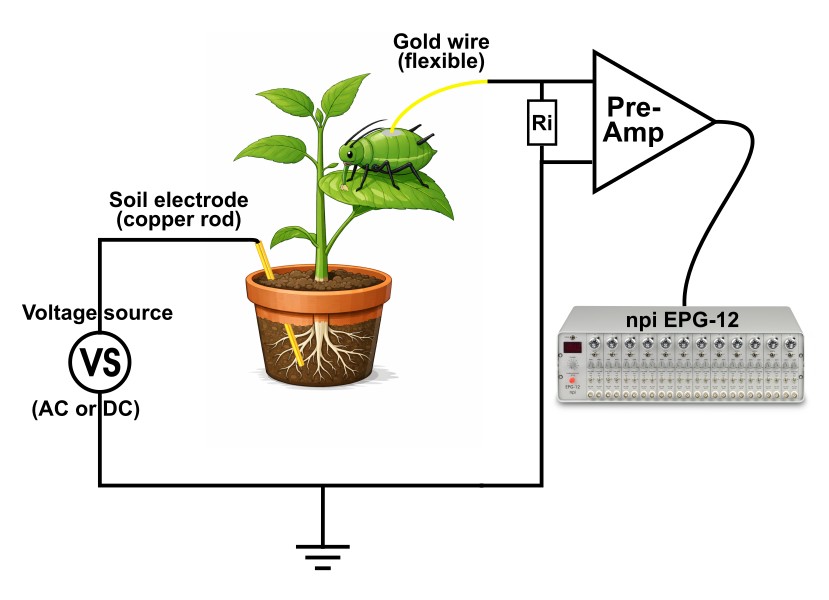
Electrical Penetration Graph (EPG) recordings are performed to measure the penetration and feeding processes of insects with penetrating mouthparts – like aphids or leaf bugs.
A voltage source (AC or DC) is connected to a soil electrode near the plant’s roots. A flexible gold wire is glued to the insect and connected to a preamplifying headstage. When an insect feeds on a plant, it completes a tiny electrical circuit. Changes inside the plant and insect generate measurable electrical signals:
- EMF – electromotive force: mainly due to fluid movements in the insect’s stylet, which create “streaming potentials”.
- R-components: changes in resistance, mainly changed by valve states in the insect’s food canal.
DC Recording – Biological Voltage Signals
- Uses and adjustable constant voltage
- Measures EMF & R-components
- Reveals physiological events (cell puncture, ingestion, salivation)
- Ideal for detailed feeding analysis
AC Recording – Resistance Changes
- Uses an adjustable alternating voltage
- Measures R-components only
- Highlights mechanical feeding activity
- Stable and robust for long recordings
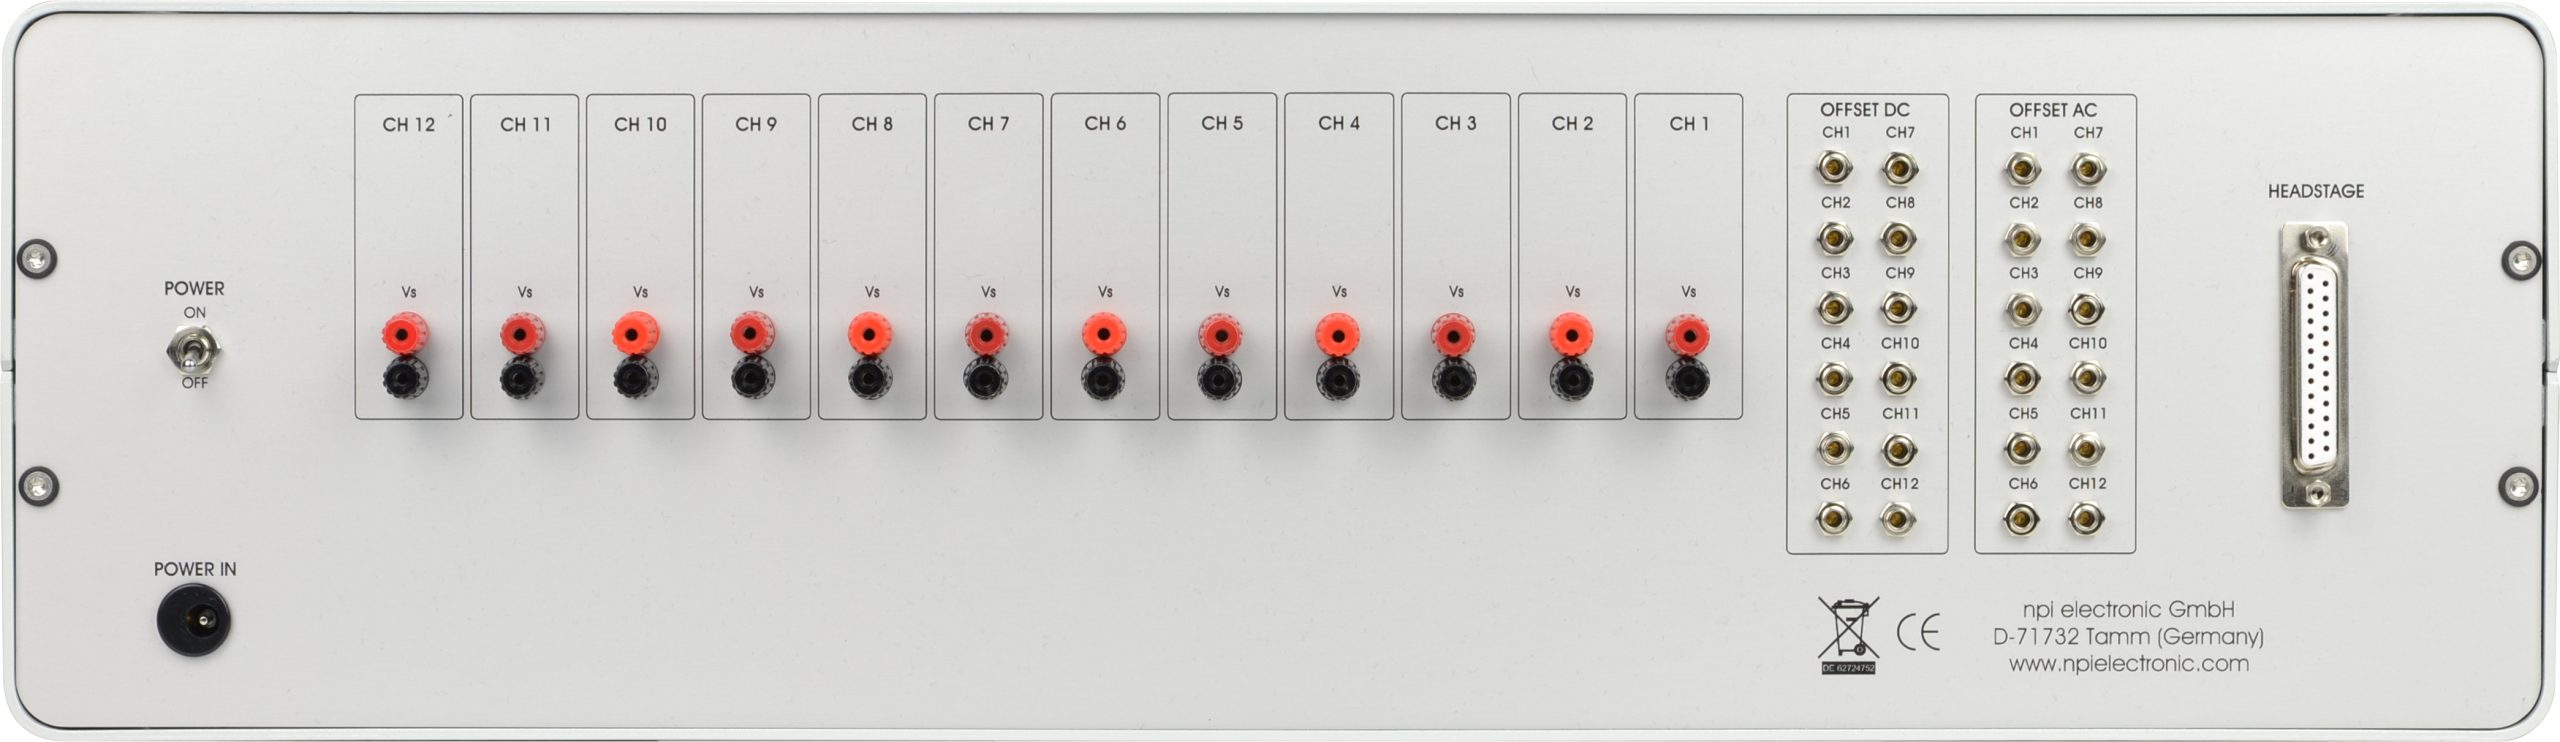
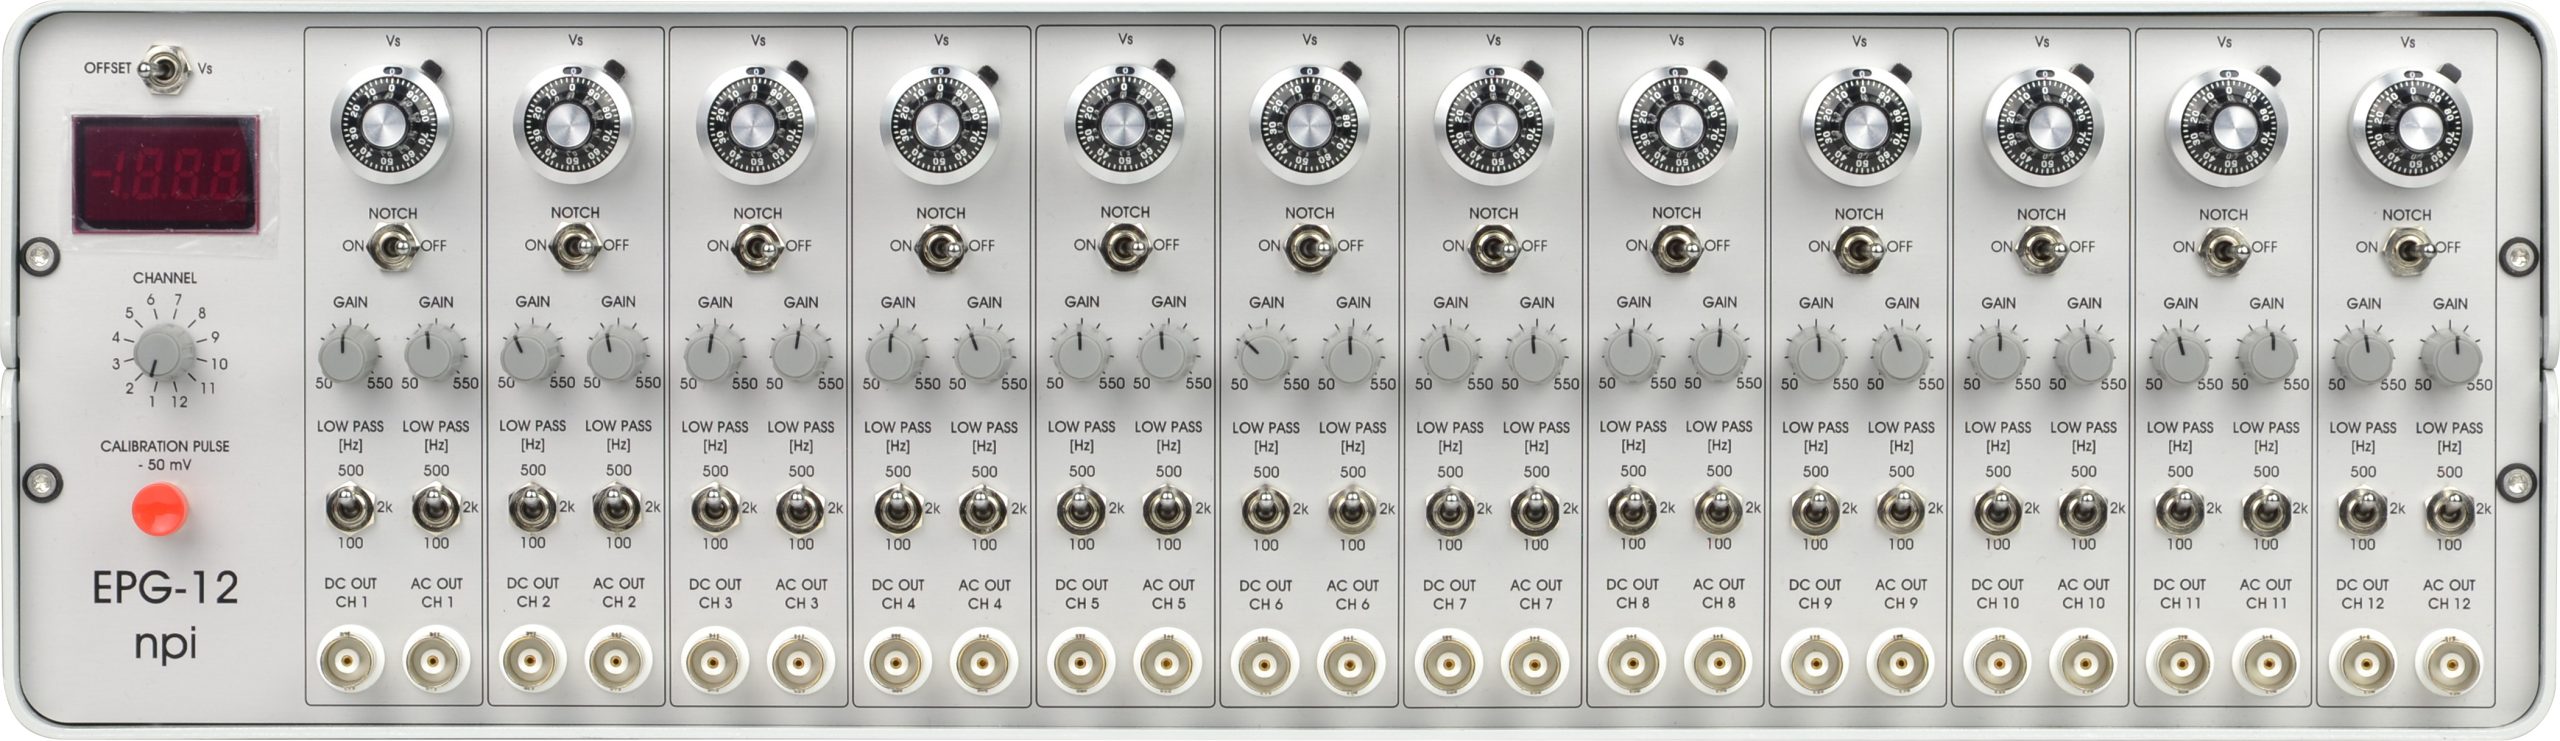
npi’s EPG-12 can record both in AC mode and DC mode.